

Introduction
The COVID-19 pandemic is ravaging the whole world. The virus is present in all countries. However, the impact for each country depends on how the leaders and health units respond to this pathogen. Unfortunately, some data collection in some countries, such as the UK and the US, indicate that certain ethnicities may be more vulnerable than others. In both countries, members of the Black communities seem to be dying disproportionally. The hypothesis is that Visible Minorities in Canada could have similar health outcomes as those in the United Kingdom (UK) and the United States (US). This review is essential as our Canadian leaders manage through the pandemic and consider the steps required to reopen the economy. One question they should consider is if the experience of certain countries applies to our context.
COVID-19 and Race/Ethnicity in the US, UK and Canada
After the initial evidence that the African American communities in the US were dying at a disproportionate rate, more heath units started sharing this information. The occurrence of Black deaths due to COVID-19 is significantly higher than that of other races and ethnicities in the US-based on the data available. African Americans make up 13.4% of the US population. Figure 1 Rate of COVID-19 deaths reported by race/ethnicity through April 30, 2020. Used with permission from Craig Helmstetter, Ph.D., Managing Partner, APM Research Lab. Dr. Helmstetter said that the team at APM Research Lab updates this particular graph regularly, typically Tuesdays and Fridays, weekly. What would be the rate in Canada?
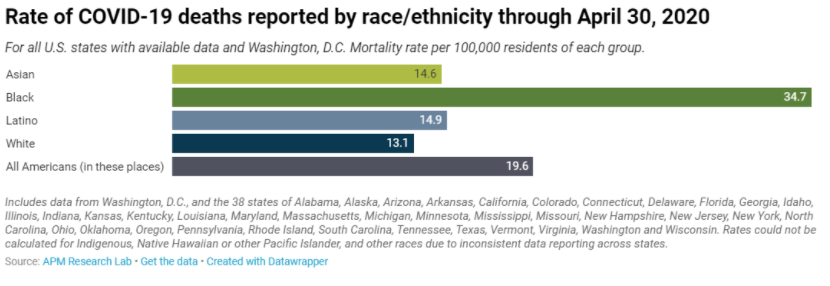
Figure 1 Rate of COVID-19 deaths reported by race/ethnicity through April 30, 2020. Used with permission from Craig Helmstetter, Ph.D., Managing Partner, APM Research Lab
Similarly, in the UK, a disproportional number of black and minority ethnic (BAME) seem to be dying from COVI19 than the other ethnic group. Another article noted that even though the Black, Asian and Minority Ethnic (BAME) group consisted of 15% of the population, they represented 19% of the COVID-19 deaths. Figure 2: Guardian’s analysis of BAME Covid-19 death rates in the UK by geographic locations posted with permissions from Caelainn Barr, Editor, Data Projects at Guardian News & Media. These deaths include medical professionals, such as nurses. Using this information, the administrators in the National Health Service (NHS) are considering action, such as removing BAME health workers from the frontline. The Institute for Fiscal Studies (IFS) from the UK published a report entitled, Are some ethnic groups more vulnerable to COVID-19 than others?. This report shared the non-uniform impact of COVID-19 on various ethnic groups in the UK, especially the Black Caribbean community.

Figure 2 Guardian’s analysis of BAME Covid-19 death rates in the UK by geographic locations posted with permissions from Caelainn Barr, Editor, Data Projects at Guardian News & Media
Other publications in the UK are showing the significant disproportionality of deaths in the NHS hospitals for the Black community. The source of the data, in this case, comes from the NHS COVID-19 Daily Deaths. Figure 3: Comparing the representation of ethnicity within the UK Population to illustration the COVID-19 deaths NHS Hospital deaths. All data up to 5 pm, April 28, 2020.

Figure 3 Comparing the representation of ethnicity within the UK Population to illustration the COVID-19 deaths NHS Hospital deaths. All data up to 5 pm, April 28, 2020
It is vital to collect race-based data as it could indicate so many things. On April 30, 2020, Canada had 53,225 confirmed cases and more than 3,100 deaths. Unfortunately, the level of testing, especially in Ontario, is lower than expected. Ontario is the largest province and contains 38.2% of the Canadian population. In general, health units in Canada do not collect race-related data for COVID-19, even though many individuals and organizations request that health units collect socio-demographic and race-related data. Currently, most health units in Canada only collect age and gender information. In Ontario, the view is that there is no need to collect race data as mostly the elderly need to be the focus of treatment. It is disappointing that the stance was taken by the York Region health unit not to collect race-related COVID-19 data. Instead, they are using map tracking for confirmed COVID-19 cases. Thankfully, the health units in Peel Public Health and Toronto plan to include race-related data to their current data collected.
Demographics related to COVID-19 in Canada
In Canada, the Working-age population in Canada is between 15 to 64 years of age. The elderly are people over the age of 65 or older. Based on the Statistics Canada website and the data from the 2011 and 2016 Census, race data is available for Visible Minority (VM), or immigrant community have a median age of about 34 years old, and they represent 22.3% of the total population. Figure 4: Age group over 30 tend to have more COVID-19 cases in Canada than younger groups, as seen on the Health Canada website on April 30, 2020.
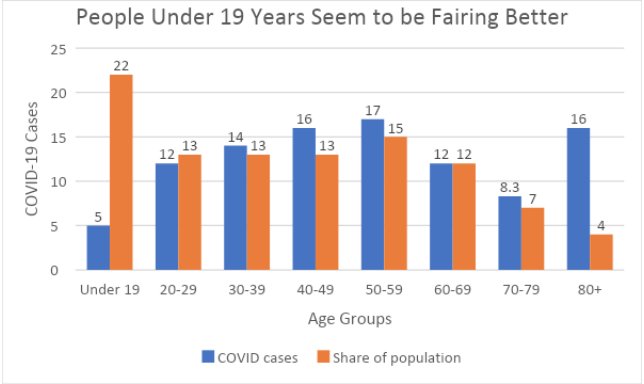
Figure 4 Age group over 30 tend to have more COVID-19 cases in Canada than younger groups as seen on the Health Canada website on April 30, 2020
As of 5 pm on April 30, 2020, there were 1,522 confirmed cases in the York Region (YR). Almost 70% of the confirmed cases are in Markham (362 cases or 24%) and Vaughan (646 cases or 43%). Table 1: Acquisition of COVID-19 within the York Region as of April 30, 2020, shows how the people infected with the virus. Most of the cases are outside institutions.
| Acquisition | Total | % |
| Institutional Outbreak | 498 | 33% |
| Close Contact | 400 | 26% |
| Local Transmission | 298 | 20% |
| Under Investigation | 165 | 11% |
| Travel | 141 | 9% |
| Unknown | 17 | 1% |
| Total | 1,522 |
Table 1 Acquisition of COVID-19 within the York Region as of April 30, 2020
Figure 5 COVID-19 in the York Region, as seen on the York Region website on April 30, 2020. Why do these geographic locations have more COVID-19 cases? Most of the deceased are from Markham and Vaughan. In general, the deaths align with the population of the municipality.
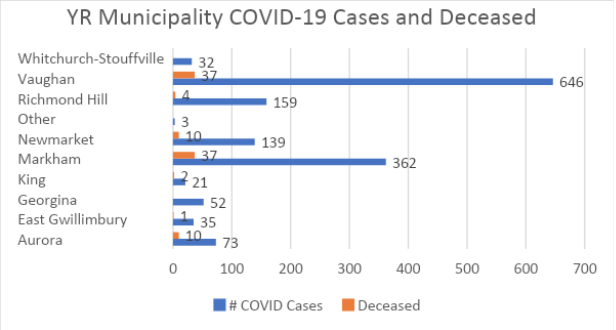
Figure 5 COVID-19 in the York Region, as seen on the York Region website on April 30, 2020
Most of the confirmed cases, 975 people (or 64%) are below the age of 65 years old. Therefore, they represent the working-age population. Figure 6: Demographics related to confirmed COVID-19 cases in the York Region as seen on the York Region website on April 30, 2020. Why are more women being impacted? Is it because more women are caregivers? What ethnicities do these women represent? Does this view align with other locations in Ontario?
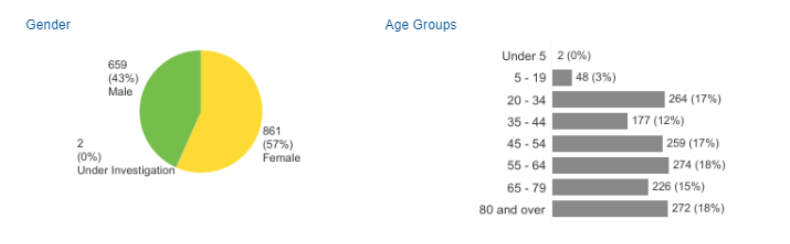
Figure 6 Demographics related to confirmed COVID-19 cases in the York Region as seen on the York Region website on April 30, 2020
Table 2 Visible Minority community in York Region affected by COVID-19 pandemic in the York Region. This information provides a sense for the immigrant (or visible minority) community potentially affected. The assumption made is that impact on all groups will be proportional to their representation in the municipality. This assumption runs counter to the actual situation in the UK and the US.
| Local Municipalities | # COVID-19 cases | % COVID-19 Cases | Population (2016 Census) | #cases / 100K people | Visible Minorities (2016 Census) | % Visible Minorities in Local Municipalities |
| Vaughan | 646 | 42% | 306,230 | 211 | 140,960 | 46% |
| Newmarket | 139 | 9% | 84,220 | 165 | 23,235 | 28% |
| East Gwillimbury | 35 | 2% | 23,990 | 146 | 4,335 | 18% |
| Aurora | 73 | 5% | 55,450 | 132 | 16,510 | 30% |
| Georgina | 52 | 3% | 45,420 | 114 | 6,010 | 13% |
| Markham | 362 | 24% | 328,970 | 110 | 192,220 | 58% |
| King | 21 | 1% | 24,510 | 86 | 5,985 | 24% |
| Richmond Hill | 159 | 10% | 195,020 | 82 | 111,225 | 57% |
| Whitchurch-Stouffville | 32 | 2% | 45,840 | 70 | 14,740 | 32% |
| Other | 3 | 0% | ||||
| Total | 1,522 | 1,109,650 | 137 | 515,220 | 46% |
Table 2 Visible Minority community in York Region affected by COVID-19 pandemic in the York Region
As of 5 pm on April 30, 2020, there were 5,551 confirmed cases in Toronto. VM population in Toronto represents 8.7% of the total population and 39.2% of the Visible Minorities in Canada. Of the confirmed cases in Toronto, most are below 60 years old (2,993 cases or 54%) and below 70 years old (3,637 cases or 66%). This information also indicates that most of the COVID-19 cases affect the working-age population. Figure 7: Demographics related to confirmed COVID-19 cases in Toronto, as seen on the Toronto website on April 30, 2020. As with the York Region demographics, more women have COVID-19 than men. How many of these women are caregivers? What ethnicities do these women represent?
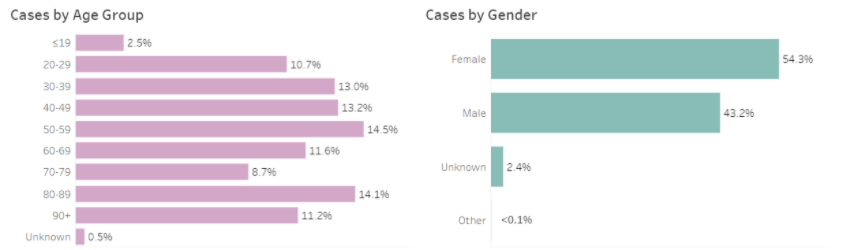
Figure 7 Demographics related to confirmed COVID-19 cases in Toronto as seen on the Toronto website on April 30, 2020
Most of the cases are outside institutional or healthcare settings as per the situation in Toronto. Table 3: Most likely source of confirmed COVID-19 cases in Toronto, as seen on the Toronto website on April 30, 2020.
| Most Likely Source (group) | % of Total Case Count |
| Unknown | 14.65% |
| Institutional/Healthcare | 18.20% |
| Close contact with a case | 23.32% |
| Community | 16.27% |
| Travel | 13.22% |
| Household contact | 14.40% |
Table 3 Most likely source of confirmed COVID-19 cases in Toronto, as seen on the Toronto website on April 30, 2020
As of 12:25 pm on April 30, 2020, there were 2,456 confirmed and probable cases in the Peel Region. Of the confirmed cases in Peel, most are below 60 (1,493 cases or 61%) and below 70 (1,832 cases or 75%). Figure 8: Demographics related to confirmed COVID-19 cases in the Peel Region, as seen on the Peel Region website on April 30, 2020. There seems to be a common theme where more women have COVID-19 than men. How many of these women are caregivers? What ethnicities do these women represent?
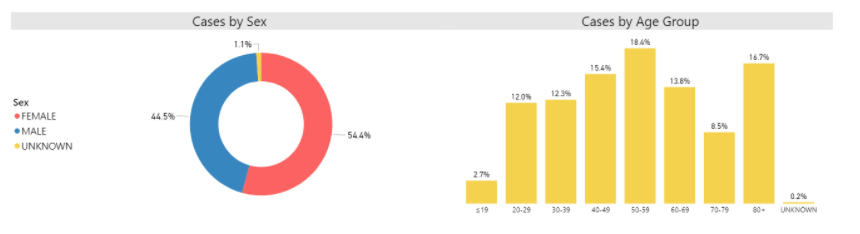
Figure 8 Demographics related to confirmed COVID-19 cases in the Peel Region, as seen on the Peel Region website on April 30, 2020
Will the working population be asymptomatic and risk infecting our vulnerable elderly? How many of the working population are vulnerable themselves because of underlying conditions? What will the testing of the people reveal to us as we prepare to reopen the economy? Table 4 Visible Minority community in Peel Region who may be impacted by COVID-19 pandemic in the Peel Region.
| Local Municipalities | # cases | % | Population (2016 Census) | #cases / 100K people | Visible Minorities (2016 Census) | % Visible Minorities in Local Municipalities |
| Mississauga | 1,216 | 52% | 721,600 | 168.51 | 381,730 | 53% |
| Brampton | 1,025 | 44% | 593,640 | 172.66 | 308,790 | 52% |
| Caledon | 62 | 3% | 66,505 | 93.23 | 16,310 | 25% |
| Pending | 32 | 1% | ||||
| Total | 2,335 | 1,381,745 | 168.99 | 706,830 | 51% |
Table 4 Visible Minority community in Peel Region who may be impacted by COVID-19 pandemic in the Peel Region
The Relationship of Race and Ethnic Data to Health Outcomes
Researchers like Mensah (2019) and Heintzman and Marino (2019) noted that the inclusion of race and ethnicity data have significance to biomedical research. They observed that race and ethnicity data have a close association with the social and economic factors which impact health outcomes. Figure 9 Illustrating the health factor that will be affected by policies and programs and drive health outcomes. Used with permission from Colleen M. Wick, Communications Associate, County Health Rankings & Roadmaps.
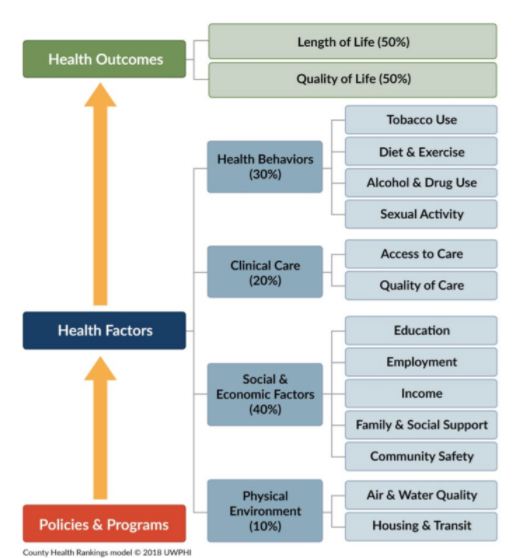
Figure 9 Illustrating the health factor that will be impacted by policies and programs and drive health outcomes. Share with permission, the County Health Rankings model. University of Wisconsin Population Health Institute. County Health Rankings & Roadmaps, 2020. www.countyhealthrankings.org
Colour of Poverty – Colour of Change shares information on many of these health factors in 10 fact sheets on the “racialized poverty” impacting our Canadian communities. Based on these fact sheets, there may be COVID-19 spikes created within some communities as the economy reopens.
- Fact Sheet #1 – About Colour of Poverty – Colour of Change
- Fact Sheet #2 – An Introduction to Racialized Poverty
- Fact Sheet #3 – Racialized Poverty in Education & Learning
- Fact Sheet #4 – Racialized Poverty in Health & Child Welfare
- Fact Sheet #5 – Racialized Poverty in Employment
- Fact Sheet #6 – Racialized Poverty in Income & Social Assistance
- Fact Sheet #7 – Racialized Poverty in Justice & Policing
- Fact Sheet #8 – Racialized Poverty in Immigration & Newcomer Settlement
- Fact Sheet #9 – Racialized Poverty in Housing & Homelessness
- Fact Sheet #10 – Racialized Poverty in Food & Water Security
Conclusion
Are some communities facing disproportionate challenges as our society addresses the COVID-19 pandemic? It is disappointing that our Black community in Canada seem to have to rely on research and data originating from places outside of Canada, such as the UK and the US, to support progressive action. As we reopen our economies, where are our vulnerabilities? Which communities should receive more resources to maintain equity in health care? What underlying conditions result in significant mortality? Only time will tell. We can hope that the VM in our country will not have the same experience as UK and US.